Author’s notes: The code produced in this tutorial represents my journey of learning Golang by developing a complete, though basic, application. If you think it can be improved – let me know.
If you’ve read my previous article, you’re likely familiar with how to instrument your JMeter tests using OpenTelemetry. That’s awesome! Can we get even more of them telemetries? Well, hold on to your socks!
The problem of problems
Some time ago, I asked my performance community how they run and measure their Kafka and MQ flows. The answers did not surprise me really but the state of understanding these protocols, did. According to the comments under my post, most of you prefer to create a set of producers and consumers, whose sole purpose is to generate the load and perform some basic assertions. What about the latency? “We measure that in the application”
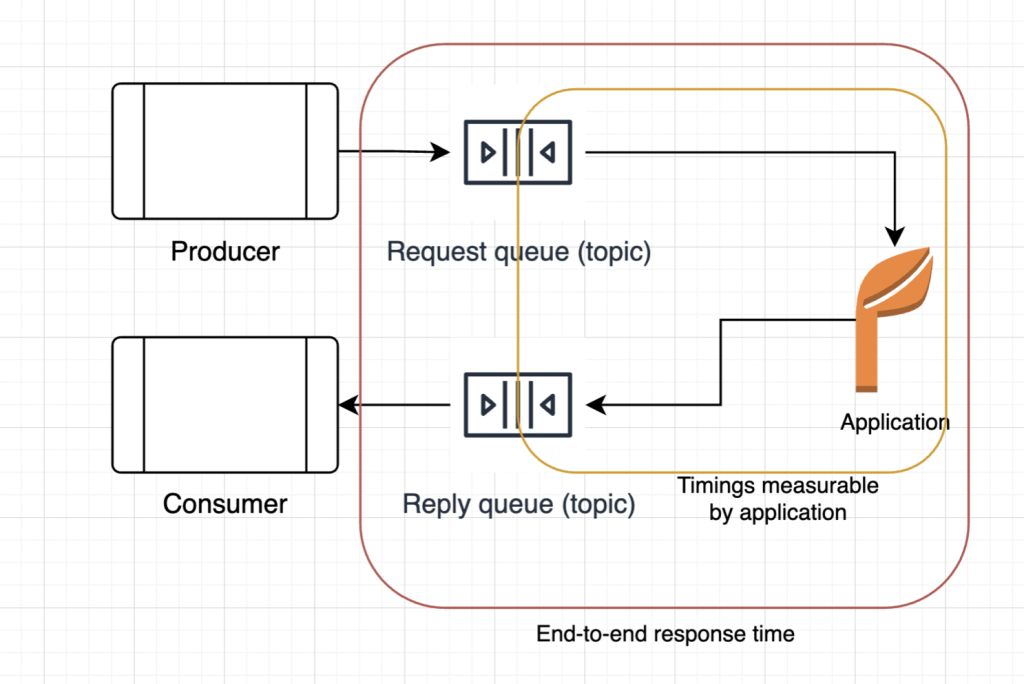
Well according to this article (highly and shamelessly recommended), here’s a picture of what you can actually measure from your application*

*unless you’re sneaking in some timestamps and measurements inside your payload/headers
What are you actually missing
The mentioned approach of consumers-producers only has a few significant flaws:
- If you don’t measure end-to-end (e-2-e) performance with your load testing tools, the expensive analysis module you’re paying for becomes useless. There, I said it – you could as well use an open source solution, like JMeter
- Timeouts? Forget it – each test run you have to compare the number of sent/received messages to ensure the delivery.
- Duplicate messages? It’s a real problem and if you don’t build proper assertions against it, you’re risking your application data integrity.
- And last but not least – you’ve got no overview of your customer’s perception and you can’t really guarantee the SLAs
Test application
I took some time to learn practical Go development (thanks, ChatGPT, for not assisting with my null pointer and channel overloading errors), and it has been a fun journey.
Because the first application you write has to be meaningful, practical and world-changing, I designed an app that can wait for 25 seconds in just half a second. That’s right – I made the waits faster with the help of concurrency. So now, whenever you can’t decide whether you should use thread.sleep() or thread.wait() with notification, you can just send your request to my application and it does all the waiting for you. All it takes is a :
- kafka cluster with 2 topics “Waiter-Requests” and “Waiter-Responses”. You can tweak the number of partitions and replicas depending on your concurrency and performance requirements
- go installed on your machine
- OTel collector (but you probably already have one)
- OTel-instrumented JMeter, from my previous article (that is if you want to load-test my app)
The architecture diagram of the app is very simple. I implemented the message bus pattern to simulate the behaviour of a commonly known Service Bus application, but also to allow high availability of my service in the future.
Golang channels can effectively act as queues, with a small exception that once the channel is full, the goroutine trying to put new object to the channel will be blocked until the channel’s capacity is freed.

Number of consumers, producers, waiter threads and channels capacity is parameterised, which makes it a perfect application to practice your performance improvements on.
But enough about the app – you’re here for the good stuff.
Apache Kafka – what do you need to know
Apache Kafka is a distributed message broker system emphasizing message persistence and high scalability. Messages in a pre-defined format (serialized), are sent to the kafka broker via Kafka Producer. Once the message is persisted on disk (or many disks), it can be read, using Kafka Consumer (and then deserialized).
Producers and consumers never communicate directly and they’re independent entities. Behaviour of consumers will not affect the behaviour of producers and vice versa – with the exception of producing a message. The consumer is not obliged to read a message and the producer will not wait until the last message it sent will be consumed.
Each topic (message channel) can be split into partitions. These partitions are the main scalability factor as they allow processing concurrency. The most common way to handle multiple partitions is by using consumer groups. Consumer group is a synchronisation mechanism between the consumers to guarantee at least once delivery of messages. Each topic partition is assigned to exactly one consumer from a group and can be read from.
Kafka broker stores the offset of the consumer group for each partition. This offset is a bookmark of where the consumer has finished reading its partition and commited it’s state. Once the partition is assigned to a new consumer, it will pick up the messages from the last commit offset. Offset from the topic end (last message put to the topic partition) is commonly referred to as topic lag. Topic lag is one of the key metrics to monitor during Kafka operations. If the lag is too high, it usually means problems.
Instrumenting Producers (Test)
Producer in my example is very straightforward. The scenario assumes one producer per thread so all the producer calls are synchronous, i.e. each request waits for acknowledgment before sending next one. It’s important to note that Kafka Producers are by nature asynchronous and allow batching of requests before they’re sent to broker. When designing your kafka test it’s important to understand how your customers will be making use of it because your e-2-e for each transaction will change drastically. If they batch too many messages for a single partition, it’ll most likely generate a lag on your consumer side. If your broker/replication is too slow, the delay will be notable on the producer side.
import org.apache.kafka.clients.producer.KafkaProducer;
import org.apache.kafka.clients.producer.Producer;
import java.util.Properties;

// Set up the producer configuration
Properties props = new Properties();
props.put("bootstrap.servers", "localhost:29092"); // Kafka broker address
props.put("key.serializer", "org.apache.kafka.common.serialization.StringSerializer");
props.put("value.serializer", "org.apache.kafka.common.serialization.StringSerializer");
props.put("acks", "all");

// Create the producer
Producer<String, String> producer = new KafkaProducer<>(props);

vars.putObject("producer", producer);
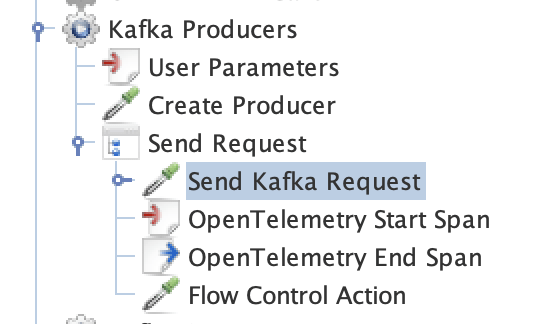
Once the Producer is created, it’s ready to send messages. Using the code from my previous article, I’m adding pre- and post-processors to create a span – now it’s accessible to me as “currentSpan” object in JMeterVariables (vars)

Send Kafka Request code:
import org.apache.kafka.clients.producer.ProducerRecord;
import org.apache.kafka.clients.producer.RecordMetadata;
import io.opentelemetry.api.trace.Span;

def producer = vars.getObject("producer");
def record = new ProducerRecord<>(vars.get("requestTopic"), UUID.randomUUID().toString(), "Kuba");
record.headers().add("traceparent", vars.get("traceparent").getBytes());
record.headers().add("responseTopic", vars.get("responseTopic").getBytes());
def span = vars.getObject("currentSpan");
span.addEvent("send-to-topic-start");
def recordFuture = producer.send(record);
span.addEvent("send-to-topic-end");

//this piece here waits for acks
recordFuture.get();
span.addEvent("send-to-topic-ack");
Let’s break this code down
we refer to the producer we created in the first step. We now have exclusive access to this producer, given our test configuration
def producer = vars.getObject("producer");Then we need to create a ProducerRecord we want to send. I’m creating a random UUID as the record key, the value of my record (message body) is my name. Not very GDPR compliant but I’m not going to complain.
Next I’m adding two headers – one of them, very important for our excercise- traceparent. This is a W3C compliant header of Context Propagators API
https://opentelemetry.io/docs/specs/otel/context/api-propagators/
The other header is just a note where I need my response back. I don’t remember now if my application will actually respect that, but here we are.
def record = new ProducerRecord<>(vars.get("requestTopic"), UUID.randomUUID().toString(), "Kuba");
record.headers().add("traceparent", vars.get("traceparent").getBytes());
record.headers().add("responseTopic", vars.get("responseTopic").getBytes());
Next step is to send the ProducerRecord we’ve just created, using our existing producer. I’m starting by extracting the span context first, because I want to mark significant events from the test side.
def span = vars.getObject("currentSpan");
span.addEvent("send-to-topic-start");
def recordFuture = producer.send(record);
In Java, the KafkaProducer is thread-safe and asynchronous. This means forwarding the ProducerRecord (our message) to broker typically does not happen as we invoke the send method. Instead in most of the cases, the producer will wait for some time and attempt to batch few messages into a single call. Two main overloaded send functions let you either define a callback method, or retrieve a Future object.
Both would materialise after the producer receives expected acknowledgements from the broker. I chose to have the future object and block my thread until the message is fully acknowledged – this way I can easily add events to my current span. Doing that asynchronously might be a challenge. After the message is acknowledged, I can safely add a new event to the current span and end my sampler.
span.addEvent("send-to-topic-end");

//this piece here waits for acks
recordFuture.get();
span.addEvent("send-to-topic-ack");
Instrumenting consumers (Test)
Working with Kafka consumers, especially if they’re part of a consumer group, you really want to limit the consumer instancing. For best performance, the best practice is to have 1 consumer per topic partition. In my test example I create a single consumer per thread and keep polling from the topic indefinitely
def props = new Properties()
props.put(ConsumerConfig.BOOTSTRAP_SERVERS_CONFIG, "localhost:29092") // Replace with your Kafka broker address
props.put(ConsumerConfig.GROUP_ID_CONFIG, "test-group") // Consumer group ID
props.put(ConsumerConfig.KEY_DESERIALIZER_CLASS_CONFIG, StringDeserializer.name)
props.put(ConsumerConfig.VALUE_DESERIALIZER_CLASS_CONFIG, StringDeserializer.name)
//props.put(ConsumerConfig.AUTO_OFFSET_RESET_CONFIG, "latest") // Start reading from the latest offset

// Create Kafka consumer
def consumer = new KafkaConsumer<String, String>(props)

// Subscribe to topics
consumer.subscribe(Arrays.asList(vars.get("responseTopic"))); // Replace with your topic name

vars.putObject("consumer", consumer);
Consumer Polling
I start with necessary imports of kafka and opentelemetry libraries
import io.opentelemetry.context.propagation.TextMapGetter;
import org.apache.kafka.clients.consumer.ConsumerRecord;
import org.apache.kafka.common.header.Headers;
import io.opentelemetry.context.Context;
import io.opentelemetry.api.common.Attributes;
import io.opentelemetry.api.common.AttributeKey;
import java.util.concurrent.TimeUnit;
Then I need to prepare the OpenTelemetry Propagation API. The TextMapGetter will retrieve relevant W3C headers (traceparent) from kafka message.
More about the propagation API here
https://opentelemetry.io/docs/specs/otel/context/api-propagators/
def currentSpan = vars.getObject("currentSpan");
def tracer = props.get("tracer");
TextMapGetter<ConsumerRecord<String, String>> getter = new TextMapGetter<ConsumerRecord<String, String>>() {

    @Override
    public Iterable<String> keys(ConsumerRecord<String, String> consumerRecord) {
        Headers headers = consumerRecord.headers();
        return () -> headers.iterator().asIterator().map(header -> header.key());
    }

    @Override
    public String get(ConsumerRecord<String, String> consumerRecord, String key) {
        Headers headers = consumerRecord.headers();
        if (headers.lastHeader(key) != null) {
            return new String(headers.lastHeader(key).value());
        }
        return null;
    }
}
Next, we reference the created consumer and we can start polling from the topic.
In Java implementation, kafka consumer would poll for up to defined time (or unless other conditions are met) and, what’s important, returns a map of ConsumerRecords fetched from the topics your consumer is subscribed to
def consumer = vars.getObject("consumer");
def records = consumer.poll(1000); // Poll for 1 second
Next we iterate over each polled records and add spans for corresponding message. Each record contains a W3C header that can be parsed by context propagator. Kafka message metadata also contains a timestamp. Kafka topic config allows 2 options for the timestamp type: Create Time (time when the ProducerRecord was created) and Log Append Time – time when the message was fully written on a topic (with all the active replicas). Since I know the record creation time from my application producer’s span data, I chose the LogAppendTime option and I’m using this timestamp to create a new event, linked to my span. Note that this event will always appear in the past, relative to polling the record.
for (record in records) {
     def extractedContext = props.get("opentelemetry").getPropagators().getTextMapPropagator().extract(Context.current(), record, getter);
     def responseSpan = tracer.spanBuilder("kafka-response").addLink(currentSpan.getSpanContext()).setParent(extractedContext).startSpan();
     responseSpan.addEvent("kafka-resp-timestamp", Attributes.empty(), record.timestamp(), TimeUnit.MILLISECONDS);
     responseSpan.end();
}
Kafka Consumer instrumentation (application)
Consumers in golang work a bit differently, the poll method doesn’t return a collection of messages – instead, you receive an event you need to handle separately. For now I’ll only focus on events that are messages only.
Similar to my JMeter consumer, I’m extracting the traceID using the propagation API and I start a new span, with the extracted trace as parent.
func (c *KafkaConsumer) poll(timeout int) error {
	ev := c.messageConsumer.Poll(timeout)
	switch ev.(type) {
	case *kafka.Message:
		message := messageFromKafka(ev.(*kafka.Message))
		ctx := getContextFromHeaders(message)

		_, span := getTracer().Start(ctx, "poll-kafka-message")
		defer span.End()

		span.AddEvent("Kafka Message Time", trace.WithTimestamp(message.timestamp))
		fmt.Println(message)
		span.AddEvent("Forward message to service")
		c.chMessages <- message
		span.AddEvent("Message forwarded to service ")
		return nil
	case kafka.Error:
		fmt.Printf("Error polling from kafka topic!")
		fmt.Printf(ev.String())
		return ev.(error)
	default:
		return nil

	}
It’s important to note that forwarding the message to a service is treated as a event as it may be a blocking call. I’ll use it as my late signal for service oversaturation (or channel length exceeding).
Service Instrumentation (application)
Since my application is a message bus, I can’t easily pass the span context between the pipeline stages and they have to be parsed each time I need the trace ID.
Note that my service really doesn’t do much apart from waiting – it’s the delay I care about to visualize and simulate the saturation of the application. If you put your name in the request body, your response will contain a message how long the service had waited for you.
func (ws *WaiterService) processMessage(message *Message) (*Message, error) {
	_, span := getTracer().Start(getContextFromHeaders(message), "wait")
	defer span.End()
	time.Sleep(time.Duration(ws.waitTime) * time.Millisecond)

	resp := message
	resp.body = []byte(fmt.Sprintf("Hello %s, i've waited for you for %d milliseconds", string(message.body), ws.waitTime))
	fmt.Println(string(resp.body))
	return resp, nil
}
Kafka Producer (application)
Similiar to Java’s producer, golang producer is also asynchronous and in order to have meaningful timings, I’m providing it a dedicated channel and wait until it receives a delivery event.
func (p *KafkaProducer) send(message *Message, destination string) error {
	ctx := getContextFromHeaders(message)
	_, span := getTracer().Start(ctx, "send-response")
	defer span.End()
	m := kafkaMessageFromMessage(message, "Waiter-Responses")
	p.producer.Produce(m, p.chDelivery)

	event := <-p.chDelivery
	span.AddEvent("response-sent")
	fmt.Print(event.(*kafka.Message))

	return nil
}
Monitoring
Now when you run your test and the application, both should start sending generated spans to your OTel collector. This is where the magic happens
For basic visualization, I’m using Jaeger collector:

The traces generated by both my test and the application are integrated seamlessly. Let’s look at the information from these traces
The trace starts with a span I named Send Kafka Request. This one is generated by JMeter and it’s a root span of all traces. The events (logs) also show significant events, like when the test script started sending the message, where the producer.send has ended, as well as when the acknowledgements were received for this message.

Next up is the Application consumer. From this span we can learn a few things:
- Kafka Message Time (in my case it’s log append time) happens before the span has been created. The time difference between this point and your consumer polling time is a great KPI for your Kafka consumer efficiency.
- forwarding message to the service is rather fast, this means there was still some space left for messages

Next there’s the service, but there’s nothing special about it. Maybe apart from the fact that the golang’s wait is not as accurate as you might expect (or my clock is skewed).

My Golang producer also waits for acknowledgement, so it’s also indicated in the logs. There’s also a warning produced by smart Jaeger – since all my spans have the same parent, Jaeger detected a potential clock skew on my machine – I can ignore this message for now, but in the future I’ll fix the span hierarchy to better match the service bus.

And last, but probably the most interesting part is the sample coming from Jmeter’s consumer. From the logs you can see the response was sent at 605.53ms, but the consumer picked up this message after 3.17s.
Without the message timestamp I wouldn’t know if the delay was coming from the Kafka producer, broker or consumer

And that’s it for this article – coming up next, we’ll add some more events, attributes, error handling, metrics and cover the most impactful Kafka event – consumer group rebalancing!
